A visible pipeline, and a shared upside
Nexus · commercial partnership proposal
Explore the ramp-up and compensation together, then read the full proposal.
Interactive executive summary
What happens if the pipeline moves earlier, the base changes, or the commission split shifts?
Illustrative assumptions, not Nexus forecasts. All amounts are SGD.
Axes use different units; zero is aligned. On phones, swipe the chart to see all 12 months.
What is left for Nexus?
Take a S$10,000 deal. This example uses the base and commission selected above.
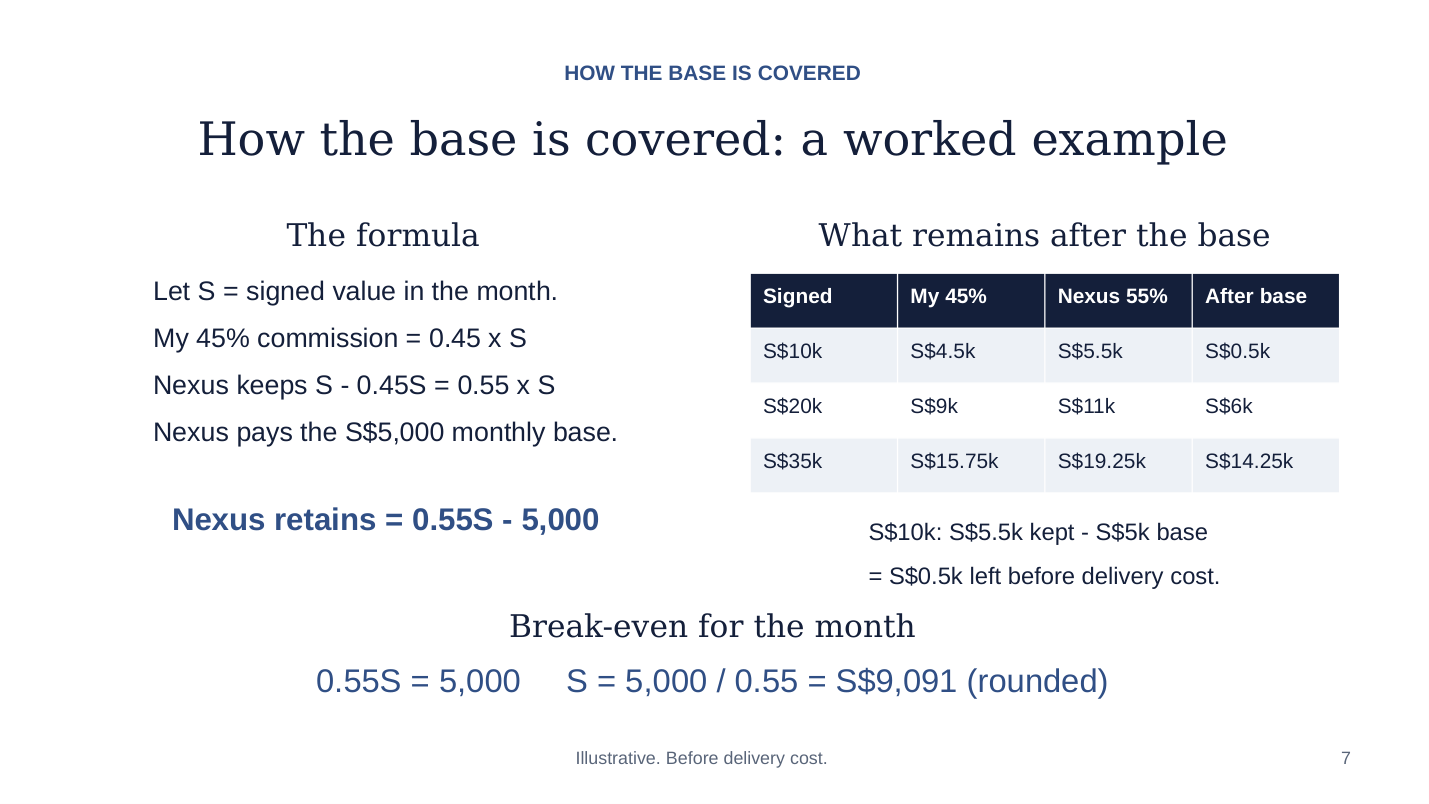
Let S = signed value in the month.
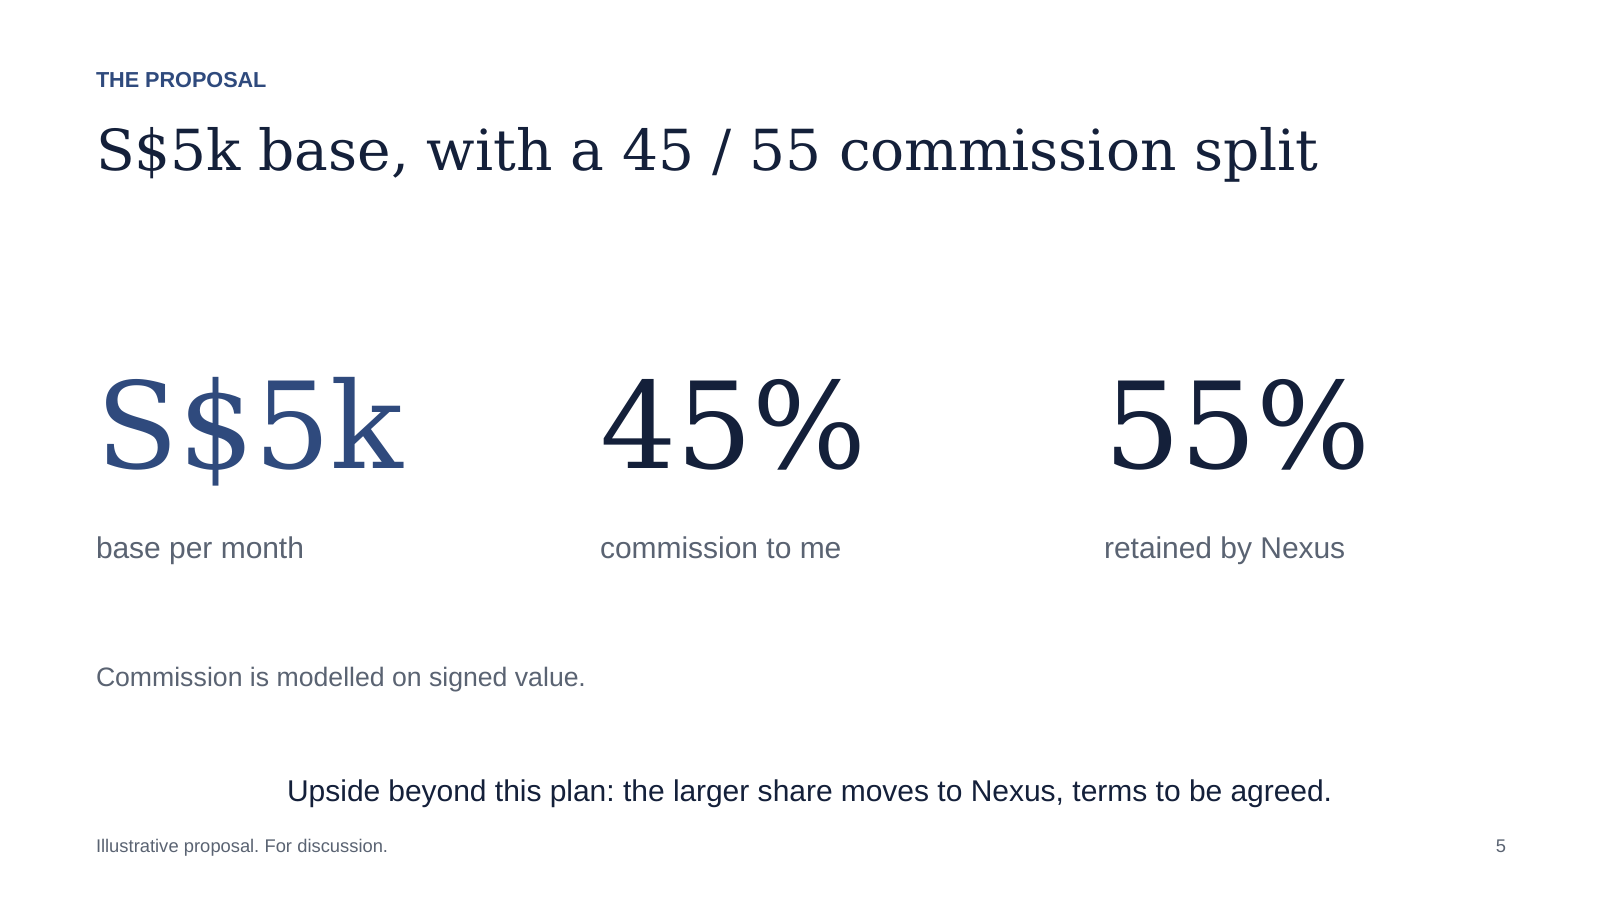
My 45% commission = 0.45 x S
Nexus keeps S - 0.45S = 0.55 x S
Nexus pays the S$5,000 monthly base.
Nexus retains = 0.55S - 5,000
Break-even: 0.55S = 5,000; S = 5,000 / 0.55 = S$9,091 (rounded).
- Ziqian's 45% commission is S$4,500.
- Nexus keeps the other S$5,500.
- Nexus also pays the S$5,000 monthly base, leaving S$500 before delivery cost.
Rule of thumb: once a month's signed deals pass about S$9,091, Nexus covers that month's base.
Illustrative one-deal months, before delivery cost. The base is paid once per month, not once per deal.
| A month's signed deals | Ziqian's commission | Nexus keeps | Nexus pays the base | Left for Nexus, before delivery cost |
|---|---|---|---|---|
| S$10,000 | S$4,500 | S$5,500 | S$5,000 | S$500 |
| S$20,000 | S$9,000 | S$11,000 | S$5,000 | S$6,000 |
| S$35,000 | S$15,750 | S$19,250 | S$5,000 | S$14,250 |
On phones, swipe the table to see every step.
See the monthly numbers and formulas
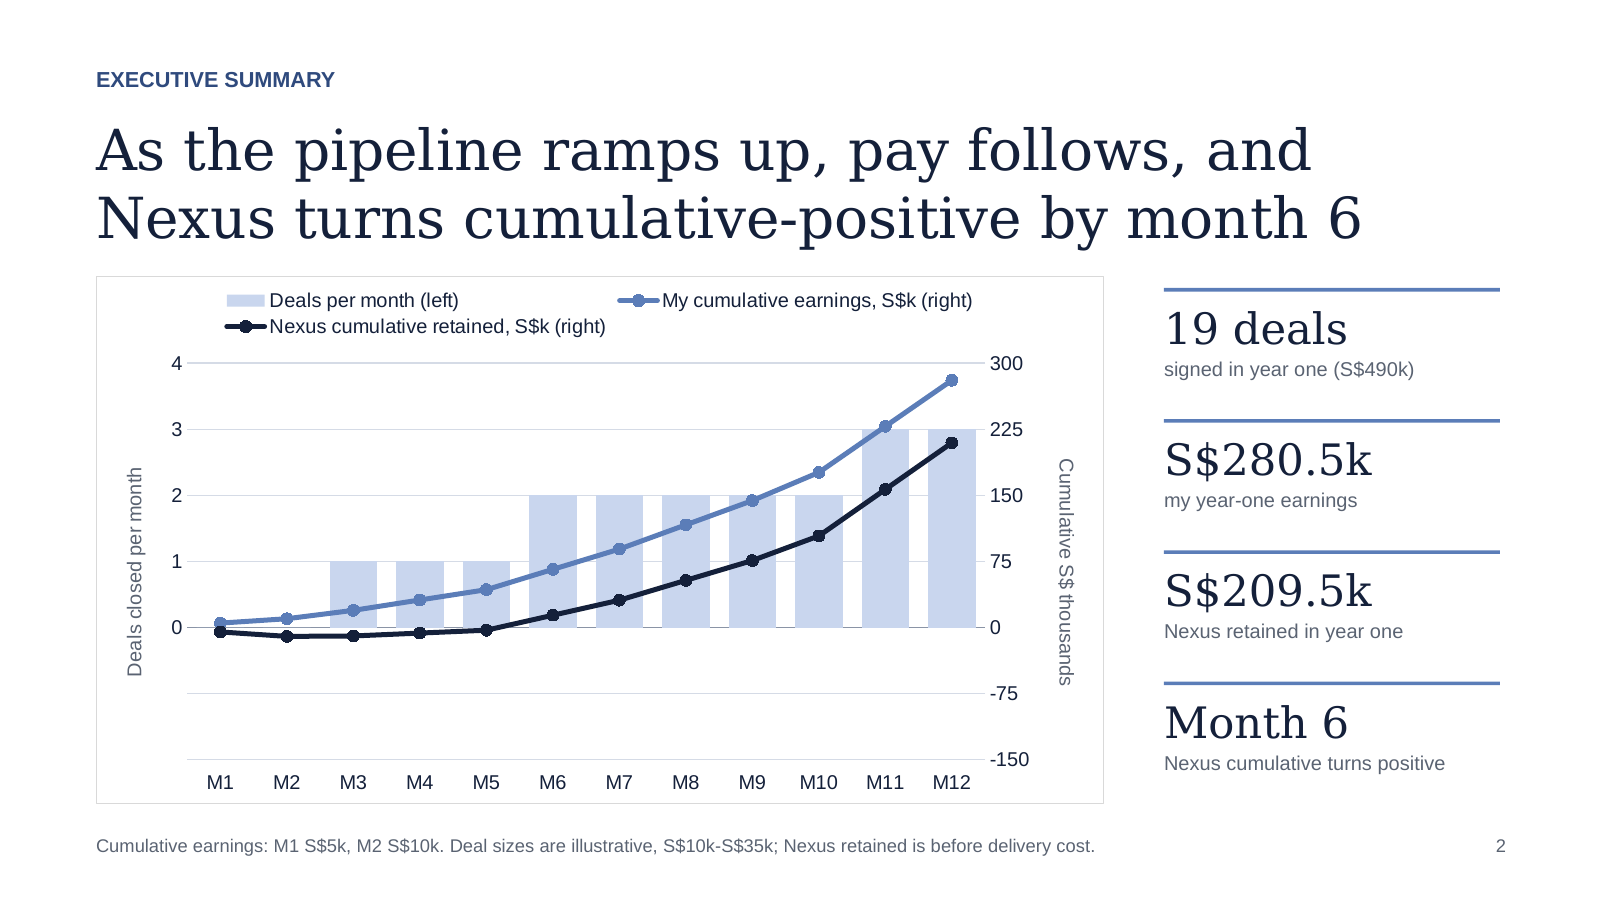
| Month | Deals | Avg deal | Signed | My earnings | Nexus retained | My cumulative earnings | Nexus cumulative |
|---|---|---|---|---|---|---|---|
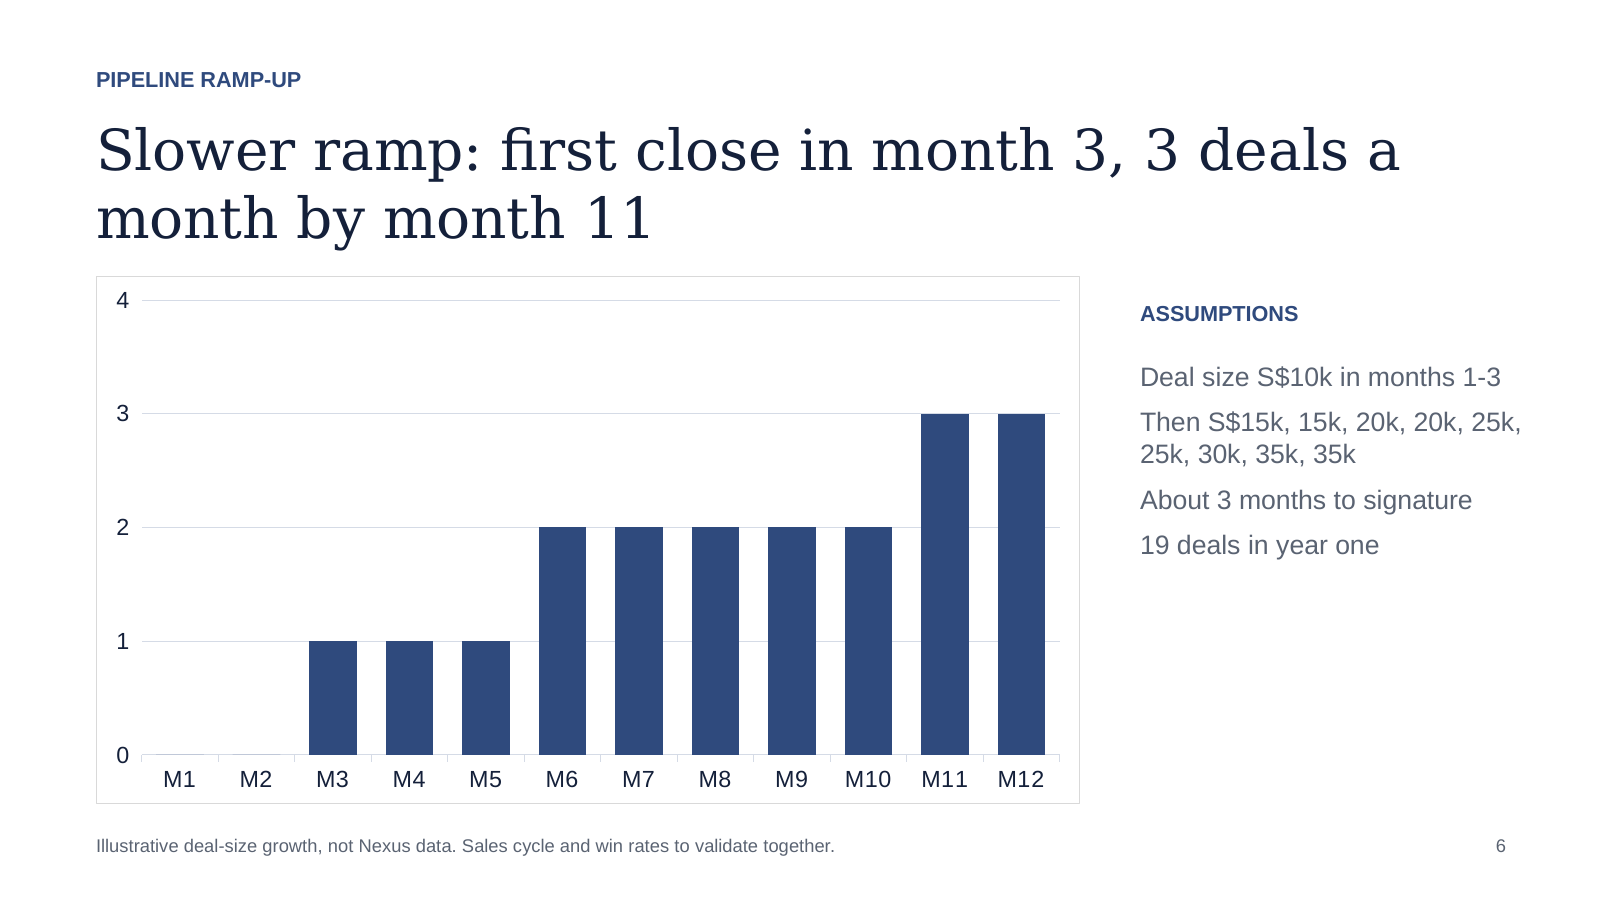
| M1 | 0 | S$10,000 | S$0 | S$5,000 | S$-5,000 | S$5,000 | S$-5,000 |
| M2 | 0 | S$10,000 | S$0 | S$5,000 | S$-5,000 | S$10,000 | S$-10,000 |
| M3 | 1 | S$10,000 | S$10,000 | S$9,500 | S$500 | S$19,500 | S$-9,500 |
| M4 | 1 | S$15,000 | S$15,000 | S$11,750 | S$3,250 | S$31,250 | S$-6,250 |
| M5 | 1 | S$15,000 | S$15,000 | S$11,750 | S$3,250 | S$43,000 | S$-3,000 |
| M6 | 2 | S$20,000 | S$40,000 | S$23,000 | S$17,000 | S$66,000 | S$14,000 |
| M7 | 2 | S$20,000 | S$40,000 | S$23,000 | S$17,000 | S$89,000 | S$31,000 |
| M8 | 2 | S$25,000 | S$50,000 | S$27,500 | S$22,500 | S$116,500 | S$53,500 |
| M9 | 2 | S$25,000 | S$50,000 | S$27,500 | S$22,500 | S$144,000 | S$76,000 |
| M10 | 2 | S$30,000 | S$60,000 | S$32,000 | S$28,000 | S$176,000 | S$104,000 |
| M11 | 3 | S$35,000 | S$105,000 | S$52,250 | S$52,750 | S$228,250 | S$156,750 |
| M12 | 3 | S$35,000 | S$105,000 | S$52,250 | S$52,750 | S$280,500 | S$209,500 |
Signed = deals × average deal. My earnings = monthly base + signed × commission. Nexus retained = signed - my earnings. Cumulative earnings = running total of my earnings. Nexus cumulative = running total of Nexus retained. The summary chart uses both cumulative totals; the table preserves the monthly amounts.
The full proposal
The proposal uses one illustrative 19-deal case. Changes above are exploratory and do not rewrite the slides.
1 / 9 · A visible pipeline, and a shared upside
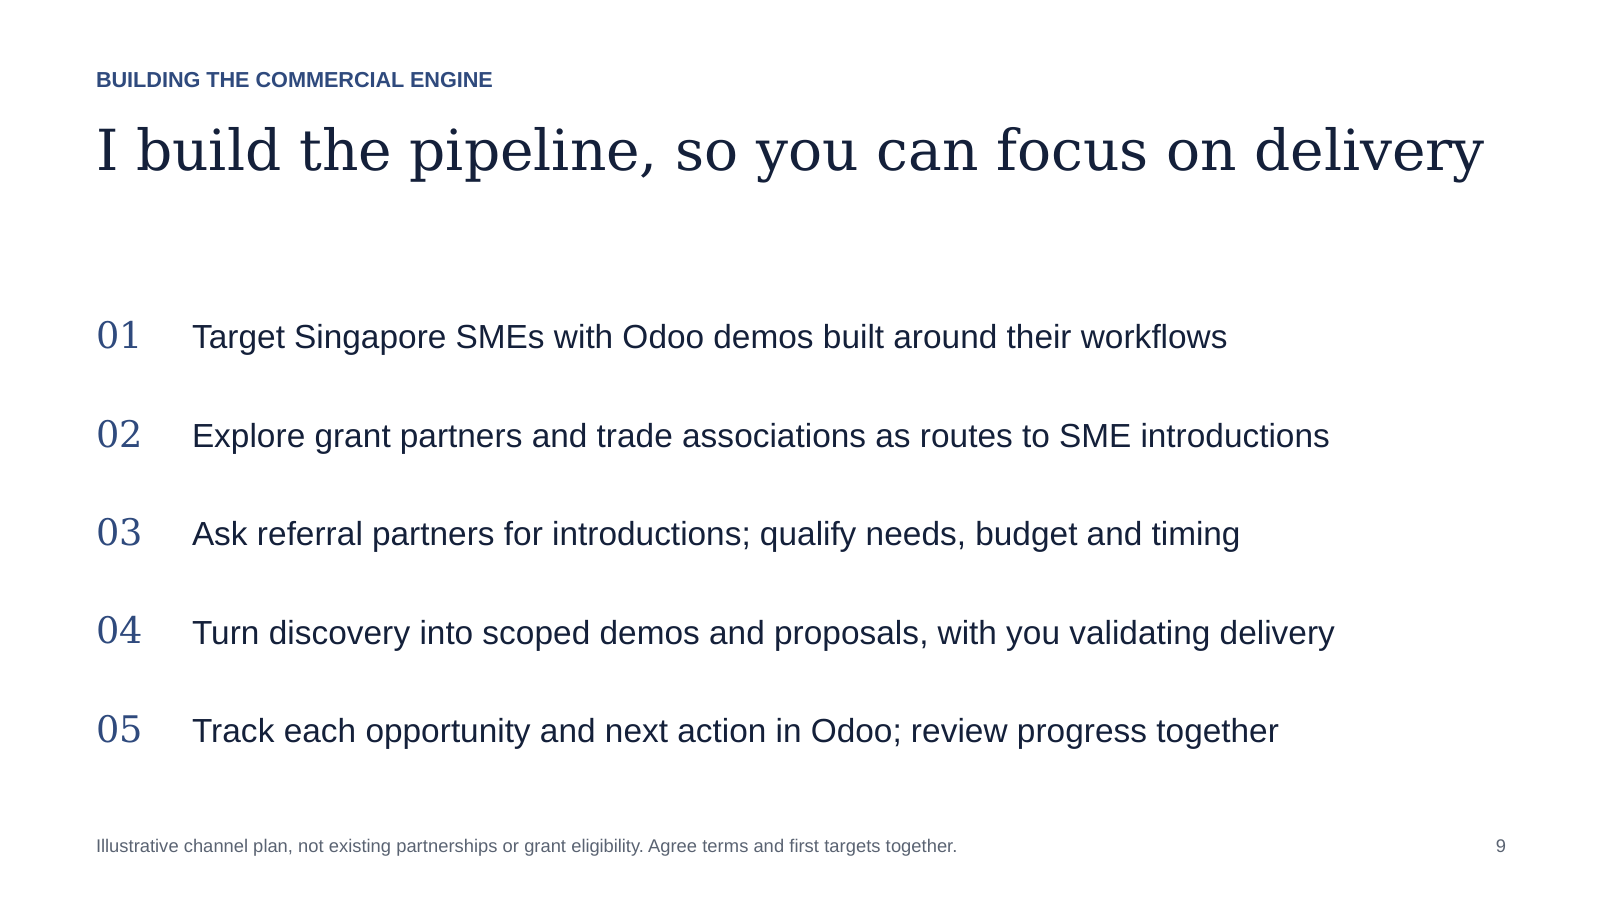
Tap a slide to read it full size.